

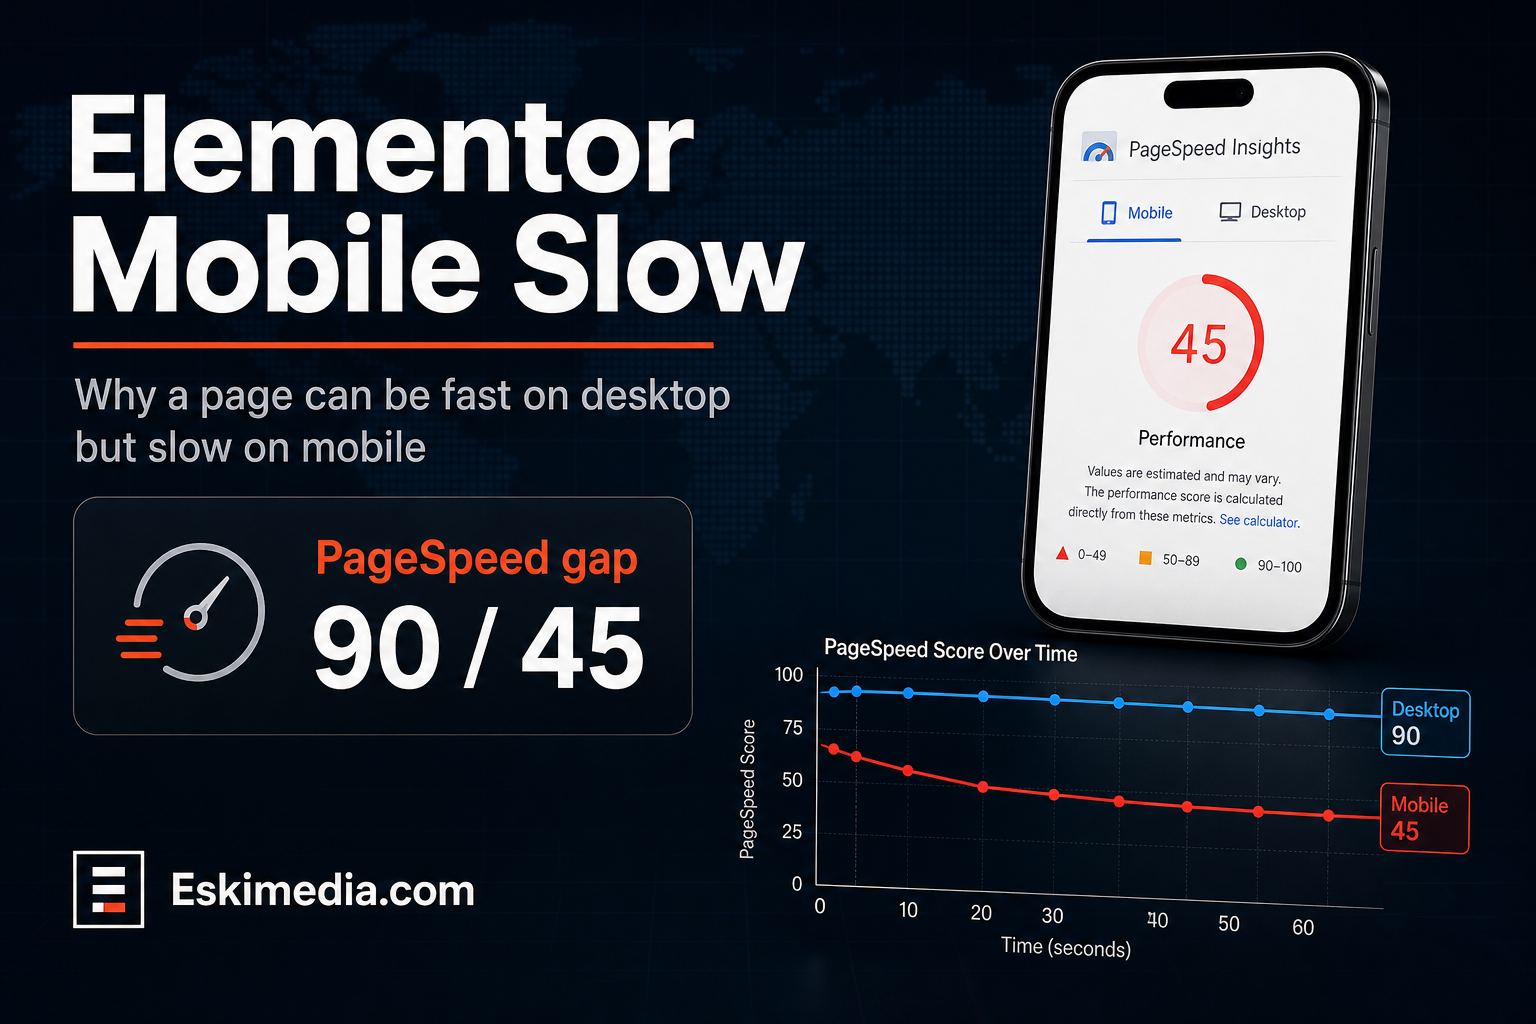

PageSpeed Insights gives your Elementor site 90 on desktop and 45 on mobile. Same page, same content, same server. It looks like something is broken on mobile specifically.
Usually nothing is broken. The two tests run under very different conditions. The mobile test in PageSpeed Insights is a Lighthouse run that simulates a mid-range phone on a slow 4G connection, with the processor slowed about four times. Elementor pages tend to ship a lot of CSS, JavaScript and nested HTML, and a slow processor is exactly where that weight shows. The desktop test has no such handicap, so the same page looks fine there.
So the gap itself is expected. The real questions are whether your actual visitors are having a slow experience, and which part of the page is causing it. Both are answerable.
First, Check Whether Real Visitors Are Affected
PageSpeed Insights shows two different things, and people often read the wrong one.
- “Discover what your real users are experiencing” at the top is field data from Chrome users over the last 28 days. If it says the Core Web Vitals assessment passed on mobile, your real visitors are mostly fine, whatever the score below says.
- The performance score below it is a single lab test. It’s useful for finding causes, not for judging the experience.
Small local sites often don’t have enough traffic for field data, in which case you’ll only see the lab result. That’s fine. Use it to find the problem rather than to chase a number.
Which Metric Is Failing Tells You Where to Look
| Failing metric | What it measures | Usual Elementor cause |
|---|---|---|
| LCP (Largest Contentful Paint) | How long until the main hero image or heading appears | Hero set as a background image, lazy-loaded hero, entrance animation on the hero, oversized image |
| TBT in the lab / INP in the field | How long the page is too busy to respond to taps | Too much JavaScript: addon plugins, sliders, chat widgets, tracking scripts |
| CLS (Cumulative Layout Shift) | How much the layout jumps while loading | Fonts swapping late, images without set dimensions, banners injected after load |
In practice, LCP is the first thing we check on a slow Elementor page, because the hero is so often the cause.
The Causes Worth Checking, in Order
1. The hero image is a background image
Elementor makes it easy to set a big photo as a section background. The browser can only discover a background image after it has downloaded and processed the CSS, so it starts loading late. If Elementor’s “Lazy Load Background Images” setting is on, the hero may be delayed further.
Fixes: use an Image widget for the hero where the design allows it, make sure the hero isn’t lazy-loaded, and set a smaller mobile-specific background image. Elementor lets you choose a different background per device. A 2,400-pixel-wide desktop photo on a 400-pixel phone screen is wasted download.
2. An entrance animation is on the hero
Elementor’s motion effects keep an element invisible until its animation runs. If the hero heading or image fades in, the largest element on screen isn’t visible until the JavaScript that triggers the animation has loaded. Remove entrance animations from anything visible without scrolling.
3. Content hidden on mobile is still there
The responsive “Hide on Mobile” setting hides elements with CSS. They stay in the page’s HTML, so the phone still downloads and processes them, and images inside can still be requested unless they’re lazy-loaded. A common pattern is a desktop hero and a separate mobile hero, both in the page, with one hidden on each device. Rebuild those as a single responsive section wherever possible.
4. The old section and column structure
Pages built before Elementor’s Flexbox Containers use sections, columns and inner sections, which produce deeply nested HTML. That nesting costs more on a slow processor. Elementor can convert old sections to containers; do it page by page, starting with the homepage, and check the layout on mobile after each conversion.
5. Icon libraries and fonts
By default a page can load the full Font Awesome library and Elementor’s own icon font to display a handful of icons. Turn on “Inline Font Icons” in Elementor’s settings. For fonts, use one or two families and only the weights you actually use, and load them locally rather than from Google’s servers.
6. Addon plugins and third-party scripts
Elementor addon packs often load their CSS and JavaScript on every page, even for widgets you never used. Most have a setting to disable unused widgets. Then look at third-party scripts: chat bubbles, review carousels, embedded maps, social feeds and tracking pixels. Each one uses the phone’s processor. Most caching plugins, including LiteSpeed Cache, can delay non-essential JavaScript until the visitor first interacts with the page.
7. Sliders above the fold
A slider in the hero loads several large images and a script before the first slide settles. A single strong image almost always performs better, and it usually converts better too.
Elementor’s Own Performance Settings
In current versions, look under Elementor → Settings (Features and Performance tabs; the names shift slightly between versions). Elementor’s help page on performance features describes each one.
- Optimized DOM Output / Optimized Markup: on. It removes unnecessary wrapper elements.
- Improved Asset Loading and Element Caching: on, then check that dynamic widgets still update.
- Optimized Image Loading: on. It marks the likely hero image as high priority and lazy-loads the rest.
- Lazy Load Background Images: on, as long as the hero isn’t a background image. If it is, fix that first.
- Inline Font Icons: on.
- Load Google Fonts Locally: on.
Test the site after each change, not after all of them. Some older layouts and addons react badly to one of these, and you want to know which.
How to Test Without Fooling Yourself
Lab scores bounce around by several points between runs. Run the same URL three times and use the middle result. Test the pages that matter, usually the homepage and your top service pages, not just the homepage. Field data updates as a 28-day rolling window, so real-user improvements take about a month to show fully.
And keep the goal in view. A mobile score in the 70s or 80s with a passing Core Web Vitals assessment is a good result for a page-builder site. Chasing 100 usually means stripping out things that help the page convert.
When Optimizing Stops Being Worth It
If a site has years of layered sections, three addon packs, a slider on every page and a theme built for a different builder, you can spend more hours tuning it than a clean rebuild would take. A redesign also has to be handled carefully so you don’t lose rankings in the process; what goes wrong in a redesign is worth reading before you decide. For broader, non-Elementor causes of a slow site, see why your website feels slow.
We build our own sites and client sites in Elementor, so this kind of mobile tuning is routine website work for us. If you’ve been through the list and the mobile hero still takes forever, send us the URL and we’ll tell you which of these is the actual cause.